Technology behind HogWeather
Temperature measurements are done using Dallas DS18B20 1-wire temperature sensors,
can be acquired for free as "engineering samples" from Dallas/Maxim Semiconductor.
Otherwise cost less than 1e at Aliexpress/Ebay.
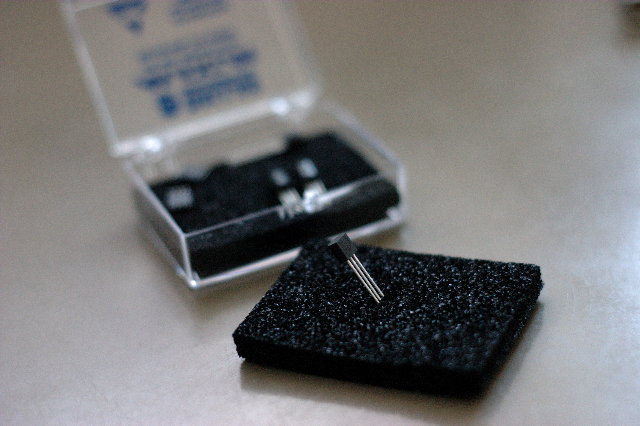
A temperature sensor, in TO92 capsule, the size of small signal transistor.
The sensors are the connected in parallel and the communication protocol/bus
keeps them separated.
For the Arduino platform, a ready-made library is available at
https://milesburton.com/Dallas_Temperature_Control_Library
The sunlight measurements come from a solar cell, scavanged out of a garden
solar lamp.
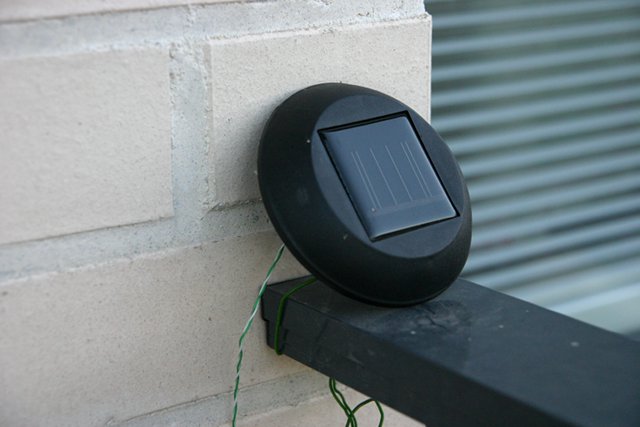
Solar panel from garden lamp.
The voltage from the cell (up to two volts) is read by the Arduino A/D converter,
upsampling to 16 bits and selecting proper internal voltage reference for
highest accuracy.
It needed to be loaded down with a 180 ohm resistor or it would quickly
saturate.
Barometric pressure and humidity are measured using digital sensors BMP085
and DHT22 respectively.
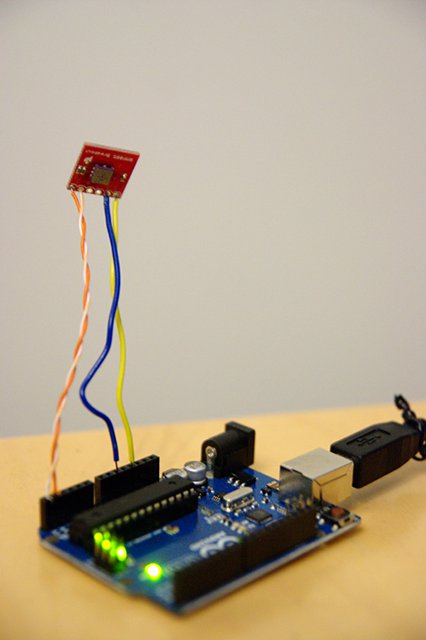
Arduino Uno with BMP085 pressure sensor
These are also easy to interface with using the Arduino microcontroller platform
(i.e. somebody already wrote the code). BMP085 speaks I2C and DHT22 has
its own 1-wire protocol.
Pressure sensor is indoors since pressure is practically the same and the sensor
is both expensive and fragile. Both also feature temperature measurements.
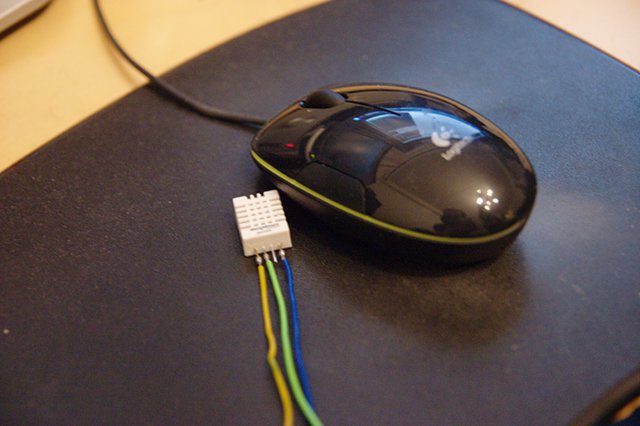
DHT22 humidity sensor with mouse for size comparison
Humidity sensors are mounted outdoors inside the solar panel box, indoors
in the hallway and in the garage.
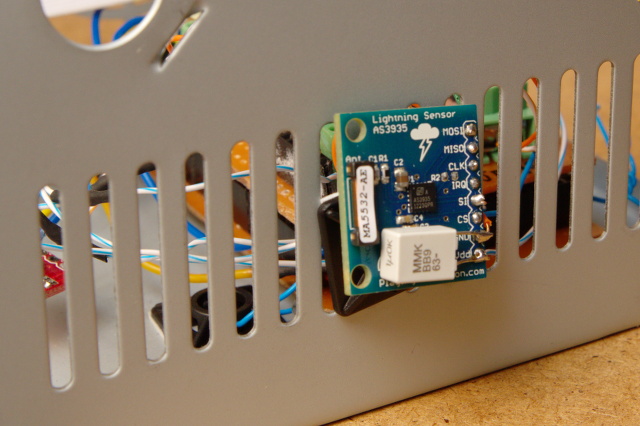
The AS3935 lightning detector breakout board - note the coil antenna
Lightning can be detected using a radio receiver - especially on medium wave
(called "AM band" on consumer radios) it can easily be heard as crackling.
The AS3935 by AMS utilizes this, as a radio receiver at 500 kHz with appropriate
signal processing to tell apart lightning from man-made disturbers.
It speaks SPI and a library for Arduino is available at
https://github.com/raivisr/AS3935-Arduino-Library.
Upon detecting a lightning event it will pull a pin low that can be made an
interrupt on the microcontroller, signalling that it has data to be read.
The Arduino will then send a UDP packet to the server that inserts it into
the database.
Garage measurement node with wireless module and DHT22 sensor, powered
by an Atmega328 with Arduino bootloader
To get measurements from the garage I am utilizing ISM band radio modules,
433 MHz.
These modules with CC110L chips also speak SPI but there is no good library
for Arduino available. Small tutorial http://labalec.fr/erwan/?p=497.
I have modified the Panstamp library for my needs.
Garage setup with block heater relay box
Garage module is powered by an Atmega328 which handles communication,
reads the sensor and controls a relay for my block heater.
It is battery powered and also reports supply voltage to indoor node.
In garage soil, a DS18B20 temperature sensor is also buried at around
30 cm depth.
Wrapping it up
All the indoor measurements are run on a homemade Arduino Mega clone
with an Atmega1280. It reads the 1-wire sensors, the BMP085, the two DHT22
humidity sensors in- and outdoors, and solar cell voltage.
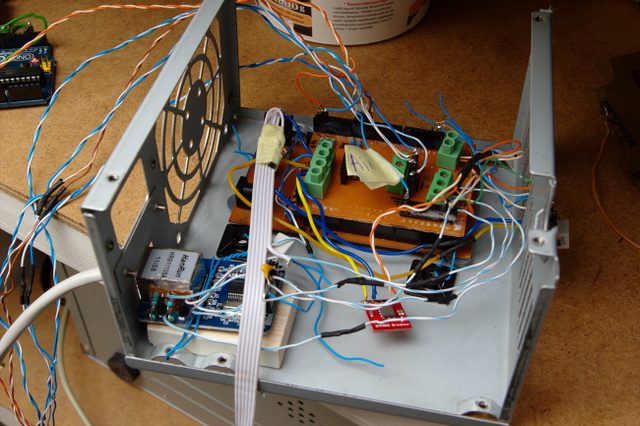
The rats nest - I've done it again, haven't I?
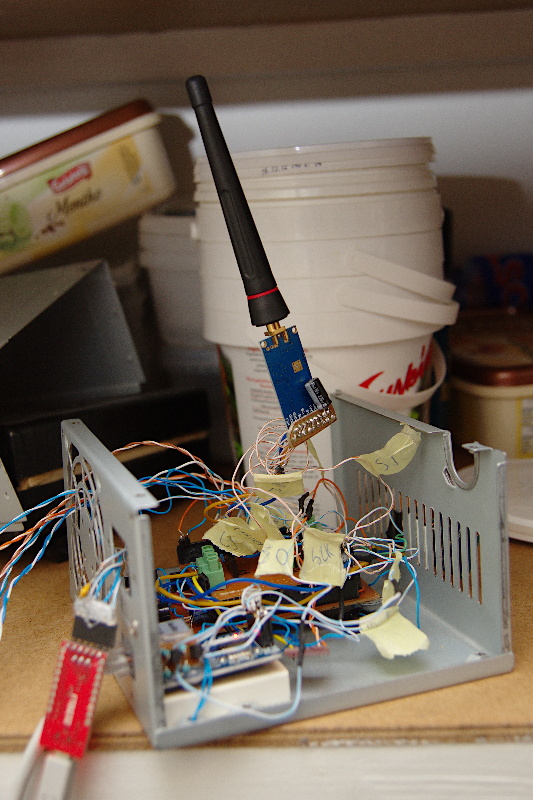
Weather station equipped with CC110L radio module for garage
communication
For receiving measurements from garage module, an identical radio module
is used in the weather station. Now total three SPI units on
the bus.
It is equipped with an ENC28J60 ethernet module using the UIPEthernet library.
Measurements are done periodically and stored internally.
On the Arduino a primitive web server is then serving the measurements as a
web page.
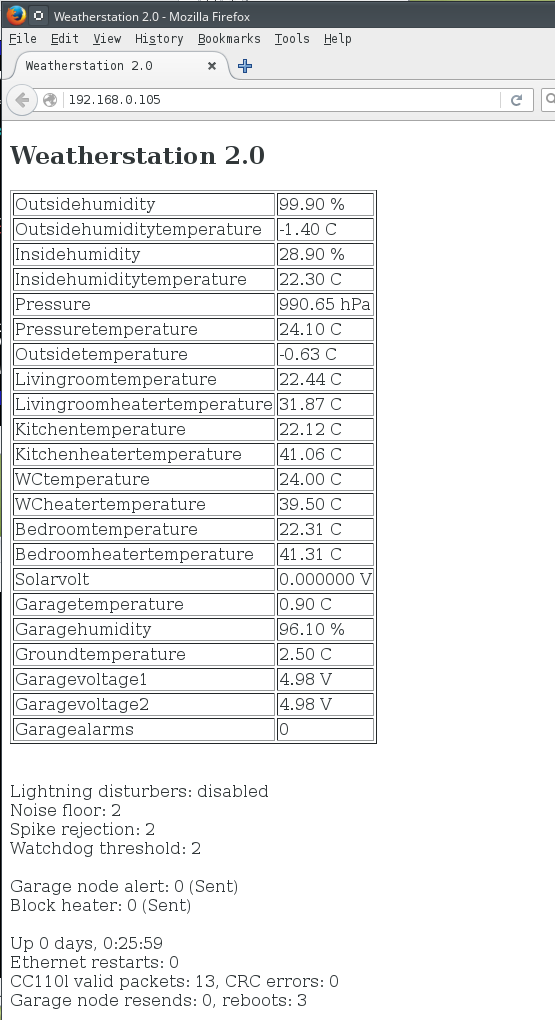
Measurements served by Arduino
My own tiny script written in Python parses each of the measurements from
the webpage, which are then stored in a MariaDB database. The script is ran
from
cron every half an hour.
The measured values are stored in a database table which can typically look
like this:
mysql> select * from livingroom order by ts desc limit 15;
+---------------------+-------+--------+
| ts                  | room  | heater |
+---------------------+-------+--------+
| 2014-01-30 18:30:08 | 21.31 |  47.13 |
| 2014-01-30 18:00:08 | 21.13 |  46.94 |
| 2014-01-30 17:30:08 | 21.25 |  46.69 |
| 2014-01-30 17:00:07 | 21.19 |  46.13 |
| 2014-01-30 16:30:07 | 21.19 |  46.19 |
| 2014-01-30 16:00:07 | 21.38 |  45.31 |
| 2014-01-30 15:30:07 | 21.38 |  45.13 |
| 2014-01-30 15:00:07 | 21.44 |  45.63 |
| 2014-01-30 14:30:07 | 21.44 |  46.19 |
| 2014-01-30 14:00:07 | 21.38 |  45.63 |
| 2014-01-30 13:30:07 | 21.38 |  45.75 |
| 2014-01-30 13:00:07 | 21.31 |  46.38 |
| 2014-01-30 12:30:07 | 21.38 |  46.44 |
| 2014-01-30 12:00:07 | 21.25 |  46.81 |
| 2014-01-30 11:30:07 | 21.25 |  46.50 |
+---------------------+-------+--------+
15 rows in set (0.00 sec)
Once the measurements are in the MariaDB database one is free to do whatever
one wants with them in the web interface. I use JpGraph to draw the graphs
(and of course PHP for everything else as well).
Old tech page for anybody interested